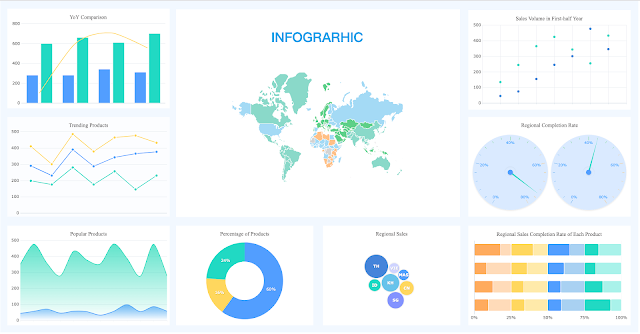
Role of data visualization techniques in business.
At present, in the world of big data the role of data visualization is
much more than it could be anticipated. So
finally let us now understand the role of data visualization techniques in the
field of business:
● Data Visualization techniques often
involve statistics of data sets thus by combining both statistics and data
visualization, businesses can transform the data into a valuable asset that
drives growth.
●Businesses often use to co-relate their different data sets. Hence to establish correlations between different data sets, data visualizations techniques can be used.

● With use of data visualization techniques, businesses can read and extract relevant insights from it to make a brand image in market in a more optimized way.
●Businesses often use to co-relate their different data sets. Hence to establish correlations between different data sets, data visualizations techniques can be used.

● With use of data visualization techniques, businesses can read and extract relevant insights from it to make a brand image in market in a more optimized way.
● A hectic task of
reading data and information generated by multiple companies and organizations is
made easier with data visualization techniques. Moreover with these techniques,
it is possible to not only read that data but also leverage it in business.


● Operational alerting is one of the many roles of data visualization It helps
marketing and other teams to stay informed about any new promotions,
product launch and so on. It allows sending visual alerts to the teams in real time.
●The overall growth of a business is measured and represented using graphics
and visuals for better understanding of how an organization is performing in
terms of sales.
Lastly. with multifold benefits in almost every industrial and commercial
field, data visualization is today’s topmost growing technique, which is
preferred by numerous data scientists and business analysts to visualize and analyse complicated sets of
data.

Comments
Post a Comment