Data Visualization and it's importance
Have you ever come across a scatter plot, a bar graph or any other
graphical image depicting data? I’m sure, you must have. These serve the
purpose of putting forward statistical results that can be studied and analysed
by many but did you ever think what are these images called? What are they used
for? Let us understand what are these concepts one at a time. Graphs, charts,
or any other method of representing data is known as Data visualization but by actual
definition, it means much more.

Data
visualization is a graphical
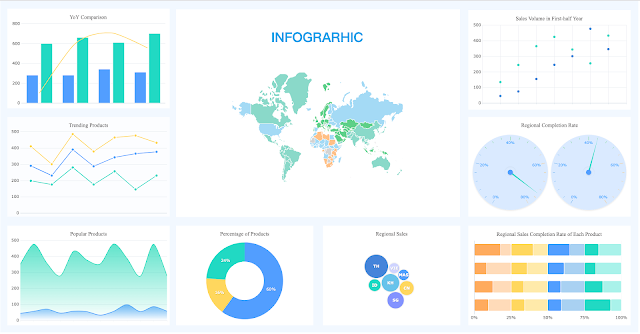
representation of information. Elements such as charts, graphs, and maps are
the few data visualization tools that give observers clarity and easier way of understanding the
represented data

Things don’t end here. With changing times, need for data and information is changing as
well. So let us now understand why is data visualization important:
● As data across the globe is at its peak nowadays, data visualization comes handy.
● Data visualization techniques like charts, plots and graphs not only represent data but gives a clear notion about co-relations between different data types.
● Data visualizations can be easily shared with others to inform people about recent market trends or any other trends in several domains.
● It also helps in case study and in-depth analysis of a particular set of data which increases interaction with visuals.
● Data visualization is updatable which means it can be modified with changes in information and tailored according to the target audience.


Comments
Post a Comment